July 4
By Randall
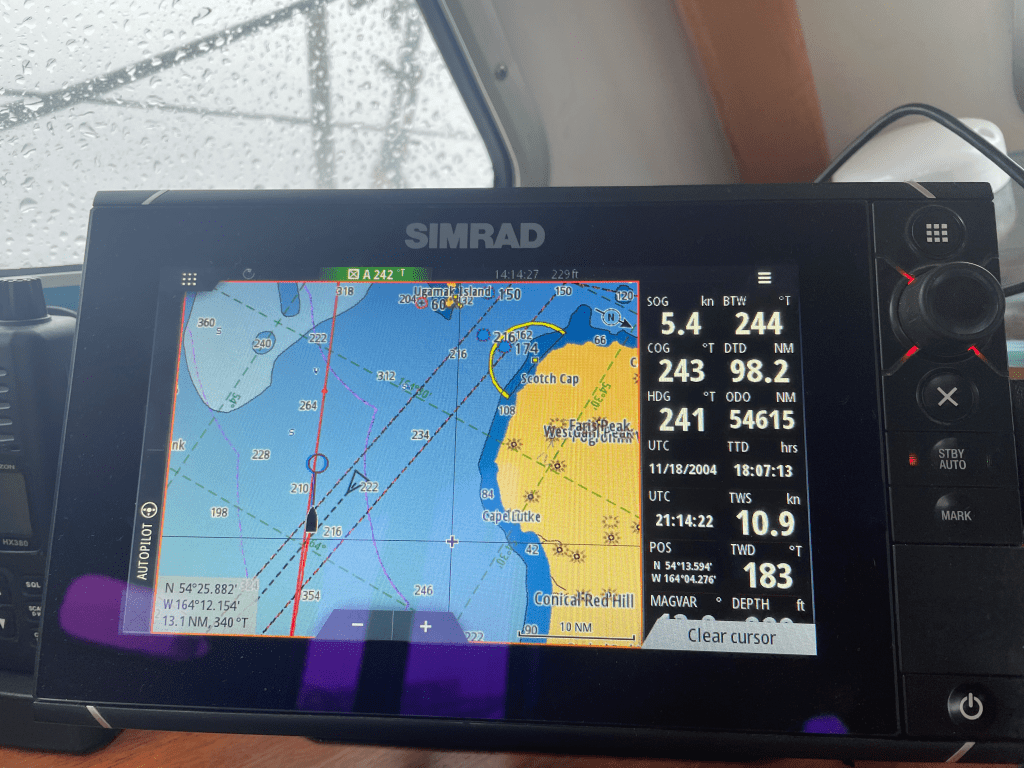
Mo is 102 miles from Dutch Harbor making 5.5 knots to the SW under power in a 10 knot headwind. Our target is the Akutan Pass, which is one of many such connecting the Pacific Ocean with the Bering Sea via Aleutian Island channels and which we should reach at the transition from stand to a north flooding current near midnight. Top flow in the passes can be greater than Mo’s boat speed, so timing is important if we wish not to go backwards. Since we entered a pea-soup fog two hours out of Sand Point, the pass at night will be pitch black. We won’t even see the current rips.
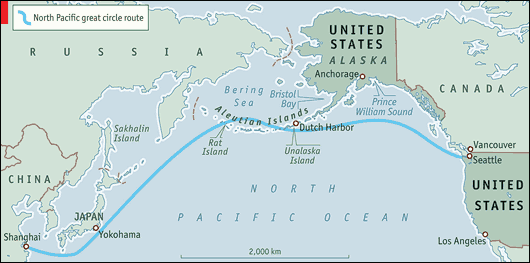
I am avoiding the bigger Unimak Pass due to its popularity with shipping. Shipping between Asia and North America often passes above the Aleutians because such creates a great circle (i.e. shorter) route between the continents. There’s little reason to add a safety variable, shipping, to the already stacked card of difficulties including night, fog, tide rips, and shoal water. Instead we go to Akutan.
–
Ice Report
As the joke goes, there is one thing we care about most on a Northwest Passage: ice and wind; no wait, TWO, two things we care about most: ice, wind and fuel availability and the avoidance of mechanical breakdown.
But joking aside, uppermost of these is ice.
In case you are not an ice chart expert, here is a quick overview.
For a west to east passage, there are two ice report sources:*
On the US side: https://www.weather.gov/afc/ice. In Canadian waters: https://www.canada.ca/en/environment-climate-change/services/ice-forecasts-observations/latest-conditions.html. Note that the Canadian charts also cover the US coast to Point Barrow. Both sites refresh their charts daily once reporting begins.
Canadian charts in particular are highly detailed and include information about surface concentration, thickness, age, ice flow direction and rate in miles per day, and more. Of these, we focus mostly on surface concentration, which is to say, how much of a particular sector we wish to transit is covered in ice of any kind.
Concentration on the charts is color coded and referred to in text as tenths of surface cover. For example, red indicates that 9 – 10/10ths of the water surface is ice covered. The rest of the key looks like this:
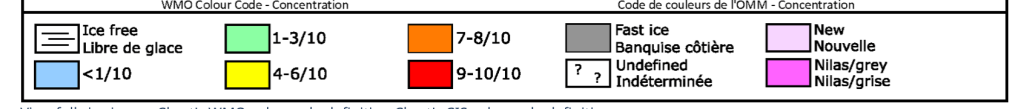
On a day-to-day basis, we don’t worry much about ice type or age because, though strong of heart and hull, Mo is not an ice breaker.** Most ice types will stop her except for nilas. Since the key to waymaking through areas of ice is to link up open leads, we need an area where there connecting open leads exist from one end of the ice field to the other. Usually this means up to about 6/10ths is what we can manage, depending on ice movement variables like wind and surface current flow.
Today’s ice chart for the Alaskan Coast looks like this:
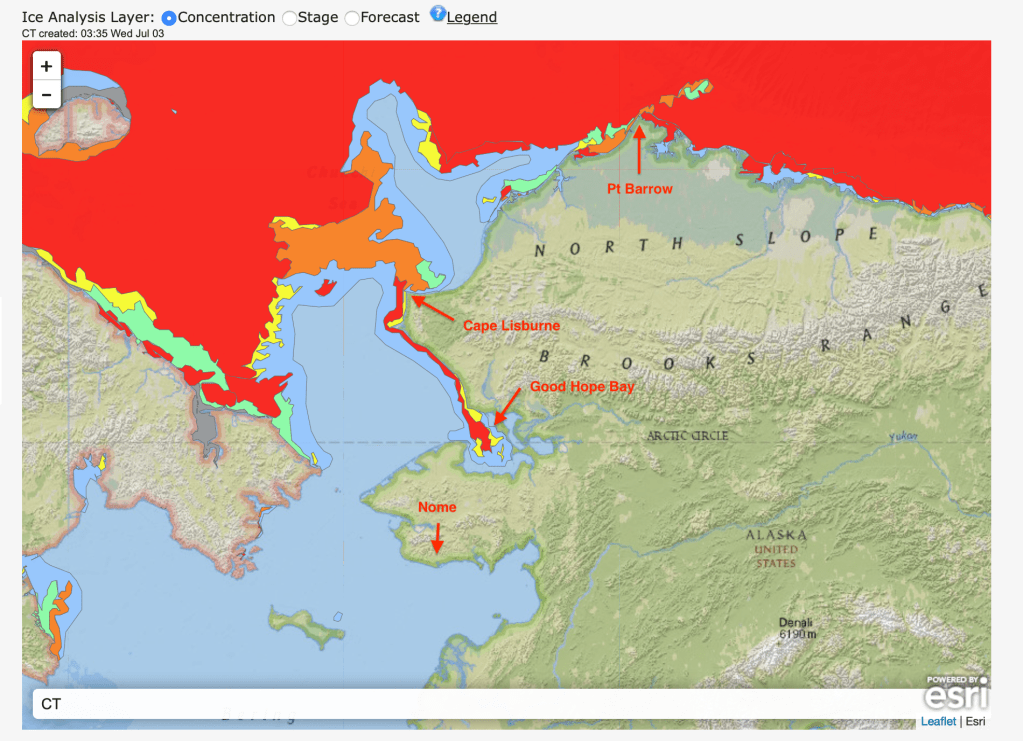
North of Nome there’s a ribbon of 9 – 10/10ths ice laying over the coast from Cape Lisburne to Good Hope Bay. This connects to 7 – 8/10ths ice in the north that then turns back into near total coverage above the Russian mainland. Even since yesterday, that ribbon is 50% narrower. Above Cape Lisburne there is mostly open water to some miles SW of Point Barrow, and there are some tiny pockets of open water beginning to form above the coast, but red dominates at moment along our route. Put bluntly, as of July the 4th, the Northwest Passage is still closed for the winter.
This week’s Canadian ice chart for the north Alaska coast and Arctic Ocean looks like this:
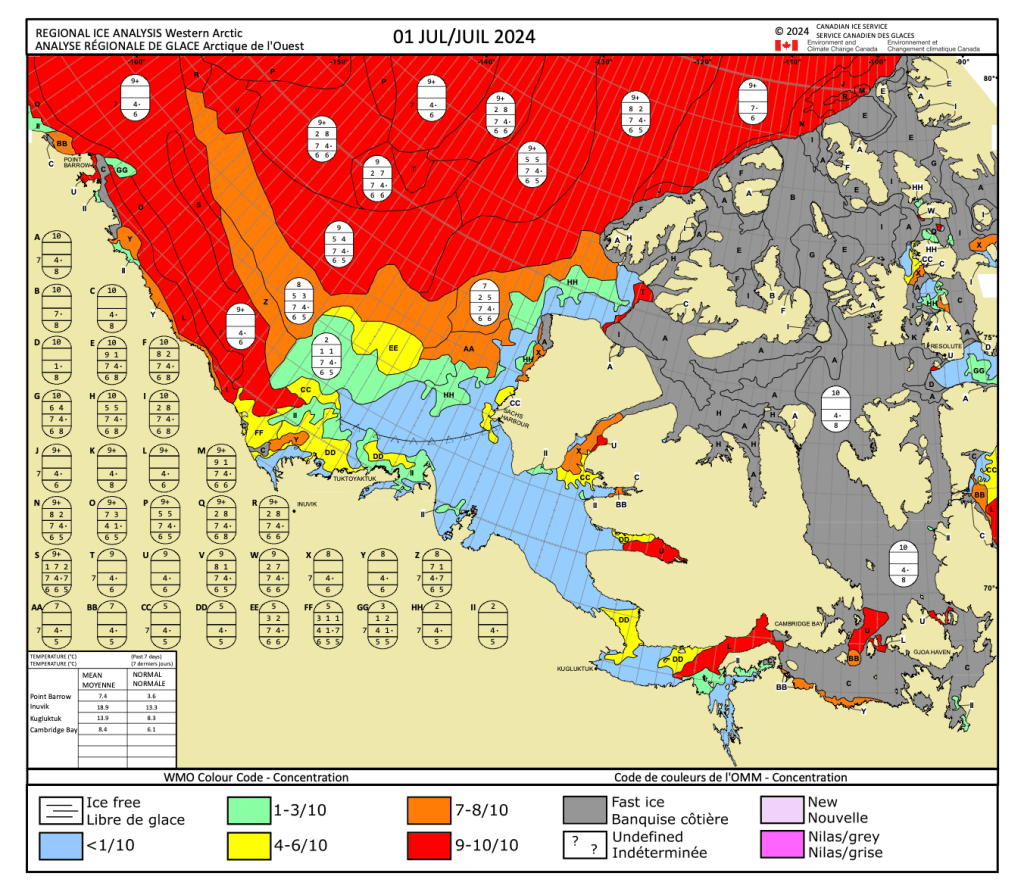
Here Point Barrow is in the upper left hand corner and the overall impression of the coast from Barrow to Tuktoyaktuk is, unless you are fond of the color red, not very inspiring. In fact, it is too early in the year to expect much by way of inspiration. If you dig into the various Canadian ice files available in the above link, you will find that most of them are blank, indicating that reporting has not begun because there has been insufficient change to winter concentrations to warrant a report. This is typical for this time of year: great masses, whether Arctic sea ice or the cold Southern Ocean, are slow to change and it takes more than the peak sun of solstice.
Environment Canada’s July season forecast for our first area of concern, North Alaska, states:
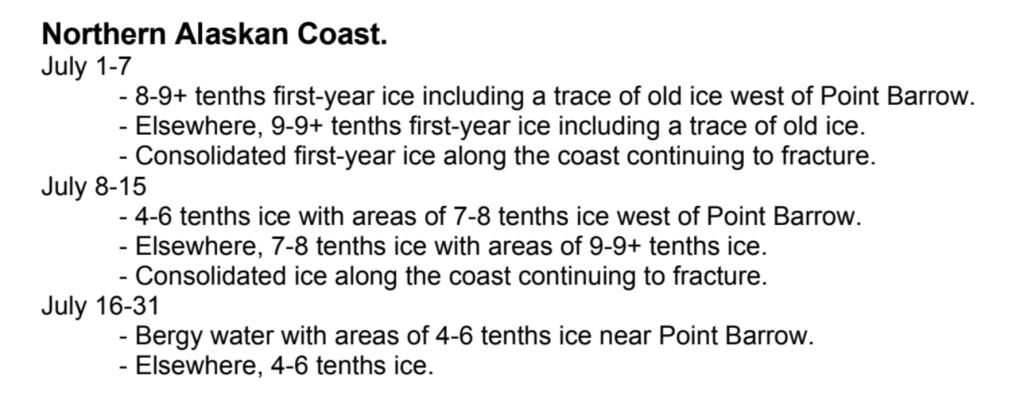
Given that we target to arrive at Point Barrow at the end of July, this appears to be good news, the current dominance of the color red notwithstanding.
–
*Sure, the same sources are available to a vessel transiting E to W, but by the time that vessel reaches Barrow, the US charts should be reporting nothing but open water to the S.
**Though age can help predict how quickly an area might clear. For example, “Thin first year ice” should have much less staying power than “old ice.”

Leave a comment